
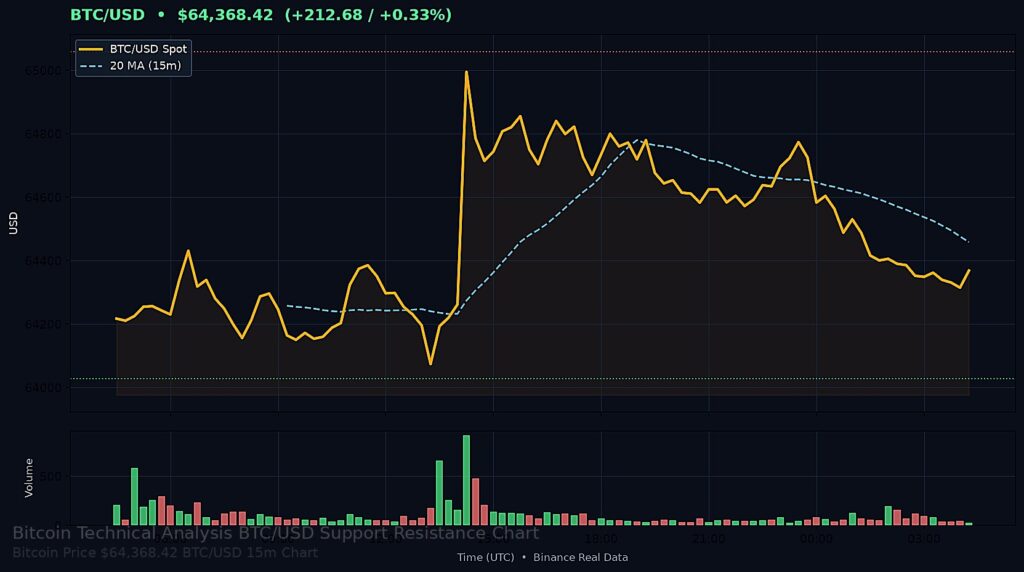
Bitcoin had a rough session today. Opened near $64,155.74 and honestly that was as good as it got for the bulls. Price drifted lower through the first few candles and never really found a solid bid to reverse it.
Bottom line — we touched a low of $64,027.85 before some dip buyers stepped in. That level held but barely. The bounce was weak. Not what you want to see if you are holding a long position into the close.
High of the day was $65,058.81. That came early. After that it was mostly a grind lower. Range came in at $1,030.96. Decent size but the price action tells you more than the number does.
What drove bitcoin price today
Nothing flashy. No single headline. Resistance near $65,058.81 rejected the first probe fast. Stops stacked up underneath and once they started going the move accelerated. Classic sell-the-rally flow.
If you have been watching BTC the last few sessions you probably saw this coming. Each bounce has been shallower. Less conviction on the buy side. That kind of price action usually precedes a bigger move down.
$64,027.85 held because someone wanted it to hold. Bid walls showed up there a couple times. Could be a whale accumulating. Could be a market maker defending a gamma level. Does not really matter. What matters is it held and now we watch if it holds again tomorrow.
Key levels
- Current: $64,368.42
- Open: $64,155.74
- High: $65,058.81
- Low: $64,027.85
- Range: $1,030.96
- Change: +212.68 (+0.33%)
Technicals after today
That $64,027.85 level is the story right now. If it breaks the measured move points to around $63,785. That is not a prediction. That is just where the math puts it.
$65,058.81 back on the upside. Need to clear that before you can even think about a trend change. Moving averages are flattening and starting to roll over. RSI is not oversold yet which means the selling can continue.
Bitcoin price today basically confirmed the bearish setup that has been brewing. Nothing catastrophic but definitely a momentum shift.
Support & resistance
- R1: $65,058.81
- R2: $65,452.64
- S1: $64,027.85
- S2: $63,784.54
Fundamentals
Dollar doing its thing. Rates are rates. ETF flows were okay. Nothing in the news that explains the move. That is actually the point — when something drops on no news it is usually structural selling or book squaring.
Hot macro print later this week and BTC is gonna test that $64,027.85 support again real quick. Cold print flips the script and we could squeeze back toward $65,058.81.
Order book data showed decent support under $64,027.85 but nothing massive. If that liquidity gets eaten we could see a faster move lower than most people expect.
Verdict
BTC at $64,368.42 down $212.68. Not the end of the world. But the trend is not friendly if you are long. Watch that $64,027.85 support. Watch the macro data. Those two things decide where BTC goes next. Until one breaks it is just chop in between.