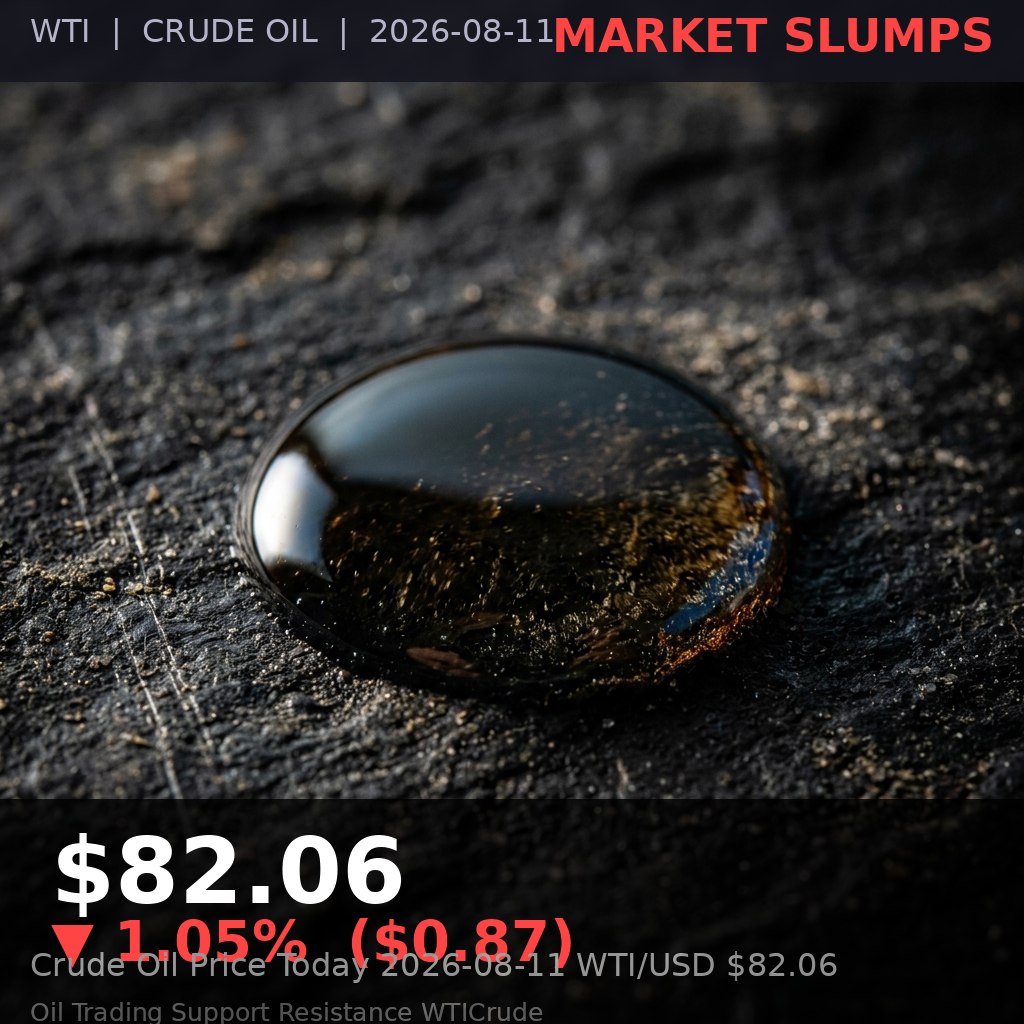
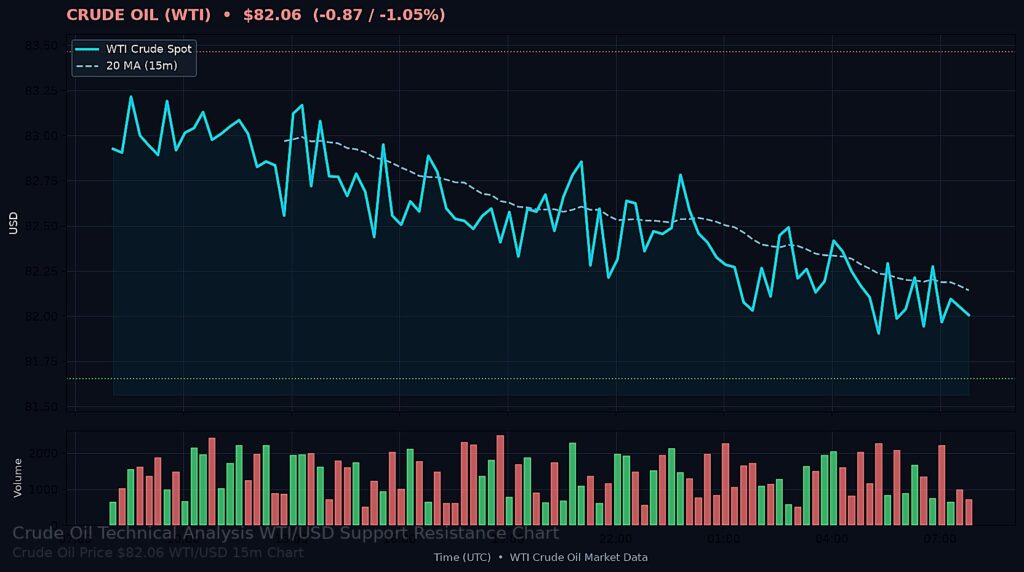
WTI crude opened the session at $82.93 and spent most of the day drifting lower, finally settling near $82.06. That’s a drop of 87 cents, or just over a percent, and honestly it feels about right. We gapped down overnight, tried to rally back toward the open, and then just ran out of buyers around midday. The range was tight, $1.81 from top to bottom, and the close near the low tells me the selling isn’t done yet.
WTI Crude Price Action: A Slow Grind Lower
The day started with a bit of hope. We printed $83.46 in the first hour, which matched Tuesday’s high almost to the tick, and for a moment it looked like we might push through. But that level held like a brick wall. Sellers came in right at that mark, and we spent the next four hours bleeding lower in a steady, orderly decline. There was no panic, no cascade, just persistent selling pressure that never let up.
What bugs me is the lack of buyers on the dip. Usually you see some dip-buying near a round number or a prior low, but we sliced through $82.50 without a fight. The low of $81.65 only printed once, late in the afternoon, and the bounce off it was weak. We closed just 41 cents off the low. That’s not the profile of a market that’s found its footing.
Where the Oil Price Found Its Ceiling
Resistance at $83.46 is now tested twice and it’s held both times. That’s a real ceiling, not a phantom one. If we can’t break that on a third try, the path of least resistance is lower. I’d rather be a seller into that level than a buyer chasing a breakout that hasn’t happened.
Key Trading Levels for the Crude Oil Market
Here’s the board as it stands. The levels aren’t complicated, but they’re clean. Support one is today’s low, support two is the next round number below that. Resistance one is the double-top we just failed at, and resistance two is the next major swing high from last week.
- Current Price: $82.06
- Open: $82.93
- High: $83.46
- Low: $81.65
- Range: $1.81
- Change: -0.87 (-1.05%)
Support one at $81.65 is the obvious line in the sand. If that breaks, support two at $81.23 is where I’d expect some real buying to show up. That’s a level from mid-July that held under pressure before. On the upside, $83.46 is the gatekeeper. Get above that and $84.16 comes into play, but I’m not holding my breath.
Support and Resistance: The Lines That Matter
I keep coming back to $81.65. It’s not a pretty number, but it’s the one that’s going to decide tomorrow’s session. A close below that on Wednesday and we’re looking at a test of $81.23, maybe even $80.80. But if we hold it and bounce, then the range trade is still alive. It’s that simple.
Fundamentals and Macro: What’s Driving the Oil Price Lower
The macro picture isn’t helping. The dollar firmed up overnight, and that’s never great for crude. We also saw some headlines out of the Middle East that suggested a possible de-escalation, and the market latched onto that as a reason to take risk off the table. It’s a thin excuse, but thin excuses move prices on slow days.
Inventory expectations are mixed. The API report comes out tonight and the market is looking for a small build in crude stocks, maybe a draw on products. If we see a bigger build than expected, that’s going to put more pressure on the downside. If we see a draw, we might get a dead-cat bounce, but I’m not convinced it’ll hold.
The bigger story is demand. China’s numbers have been softer than expected, and that’s been hanging over the market for weeks. Europe is a mixed bag. And the US is still consuming, but the pace of growth is slowing. None of that is new, but it’s the backdrop we’re trading against. Nobody wants to be long into a market that can’t find a catalyst.
The Bearish Case for WTI Crude This Week
Honestly, the bearish case is easier to make right now. We’re below the open, below the midpoint, and closing near the low. The momentum is down, the macro is soft, and the geopolitical premium is shrinking. Unless something surprises us overnight, the path of least resistance is lower. The only thing that gives me pause is that we’ve seen this setup before and then reversed hard on a headline. But you can’t trade on “what if”.
Bottom Line: Don’t Chase the Oil Price Rally Yet
I’m not buying the dip here. The close near the low, the failed rally at $83.46, and the soft macro backdrop all point to more downside risk. The trade is to sell strength into $83.40 or wait for a clean break of $81.65 and then look for a retest of $81.23. If we hold $81.65 on a retest and bounce, then I’ll reconsider. But until that happens, I’m leaning short.
That doesn’t mean it’s a one-way street. A surprise draw in tonight’s API report or a headline out of the Middle East could flip this in a hurry. But as it stands, the market is telling you it’s heavy. Listen to it. Keep your stops tight, don’t over-leverage, and wait for the move to develop. Tomorrow’s open will tell us a lot. If we gap down through $81.65, the game changes. If we hold, we’re range-bound again. Either way, the levels are clear and the plan is simple.